

4 ways share of search can drive your business strategy
If you are racing to digitally optimise your sales and marketing strategy, you’ll need commercially-relevant, statistically-valid, and market-responsive insight to plot the course ahead.
In this article, we explore the untapped treasure trove of business-actionable Share of Search data and take you through four ways it can drive commercial planning.
This article provides an executive introduction to search and an overview of the techniques we use to answer some of the key questions that sales, product, and marketing leaders ask time and time again. The article uses real-world examples from a range of clients to demonstrate how these techniques could help your own decision making.
Contents
Intro: Search in 60 seconds
Is our market growing or declining? Is share of demand for our brand & products growing or declining in that market? Using share of search as a commercial KPI
Is our marketing improving vs our last launch and vs the competition? Does search correlate to sales and market share? Using search data to benchmark demand generation effectiveness
What are the consumer needs that our product marketing & advertising need to focus on? Using search as a big-data consumer insight tool
How can I predict changes to my market? Using search as a predictive tool
Summary

1. Search in 60 seconds – an executive summary
If you know your SEO from your PPC then skip on – if in doubt, this 1-minute primer will decode the search essentials that everyone from apprentice to CEO should know.
-
Google, Bing, and other search engines are essentially marketplaces where the demand of individual’s needs meets fulfilment from commercial and non commercial suppliers.
1. Search Demand is when an individual types what they need & clicks ‘Go’ – this is called a Search Query
2. Search Supply is when results are presented as search Impressions in one of two ways:
A. Paid - where advertisers bid on target Keywords (contained within Search Queries) & show Text Ads at the top of results. If the user clicks a Text Ad the brand pays per click (PPC). It does not cost the advertiser anything if the user does not click.
B. Unpaid – where ‘Organic’ links to relevant sites are presented under paid ads. The quality of the site and its Search Engine Optimisation (SEO) determines the Position in results. SEO takes quality content and months and years to mature into page 1 search results - but each click is free. The increasing use of Ad-Blockers (now at 20% penetration in the UK) increases the importance of SEO as paid Text Ads are not shown.
Capturing Search Demand, by achieving competitive Impression share (i.e. % of times a brand is shown for a query), then strong Click Through Rate (CTR) from paid and unpaid channels is fundamental to any digital marketing team.
The focus of this article is the use of the Search Demand data – particularly for products, services, and their underlying benefits - to drive high level strategic planning beyond the marketing team. The application of search data in these areas is, in our experience, an untapped opportunity and one that can add big-data weight to a wide range of strategic use cases.
-
The amount of readily accessible insight from search is unrivalled as we will go on to demonstrate - but it is important to recognise the changing landscape it occupies from the outset. Gone are the days when Google was the only entry point to the internet and now – for product searches at least - it is Amazon that is the primary destination for digital shoppers (47%) vs search (34%) in many Western Markets.
Google does however, remain the primary entry point for other search types and the availability of data offers an incredible proxy for wider intent and behaviour.

2. Is our market growing or declining? Is share of demand for our brand & products growing or declining in that market?
Google search volumes serve as an excellent proxy for a product’s digital demand. Adding together the search volumes for your product with volumes for relevant competitors you can gain an understanding of total market demand. This total market figure can be tracked overtime to provide a gauge of market growth. With total market demand established, your product’s individual search volumes can be expressed as a share of total market volume. This share figure represents your product’s share of search, which in turn serves as a proxy for share of market demand.
This is a powerful benchmarking metric and can be tracked overtime to quantify your product’s increasing or decreasing share of total market demand. Taking this one step further, it is also possible to use total market search volumes to understand a market’s seasonality. Tracking volumes over multiple years will reveal peaks and troughs that correspond to a market’s key seasonal highs and lows.
Let’s look at some examples to see how share of search figures reflect real world market dynamics. When considering the following examples it’s important to note that we have used our own proprietary technique to manipulate Google’s raw data. Later in this article we’ll consider some examples that use Google trends, a user friendly data source that anyone can leverage.

-
The table below displays search volumes for the UK’s leading online food delivery platforms over 12 months from July 2021 to June 2022.
Note that individual cells show a company’s share of total market search volume for that month, whilst the right most column shows the year-on-year change in each brand’s share.
Share of search’s usefulness as a proxy measure is highlighted by how closely these figures track real world market shares. In 2021, Just Eat was the UK’s market leader with a market share of 45%, whilst UberEats and Deliveroo held a market share of 26% each (Edison Trends).
This is reflected in the table where Just Eat is the clear leader, with Deliveroo and UberEats trailing in second and third with relatively similar share figures.
Looking at changes over the 12-month period, we can see that Deliveroo has increased its relative share whilst Just Eat’s share has fallen. Again, this is corroborated by real world market observations with Deliveroo gaining UK market share in Q4 2021 (Deliveroo News Room), whilst Just Eat suffered a 7% fall in H2 2022 order numbers (Investors’ Chronicle).
-
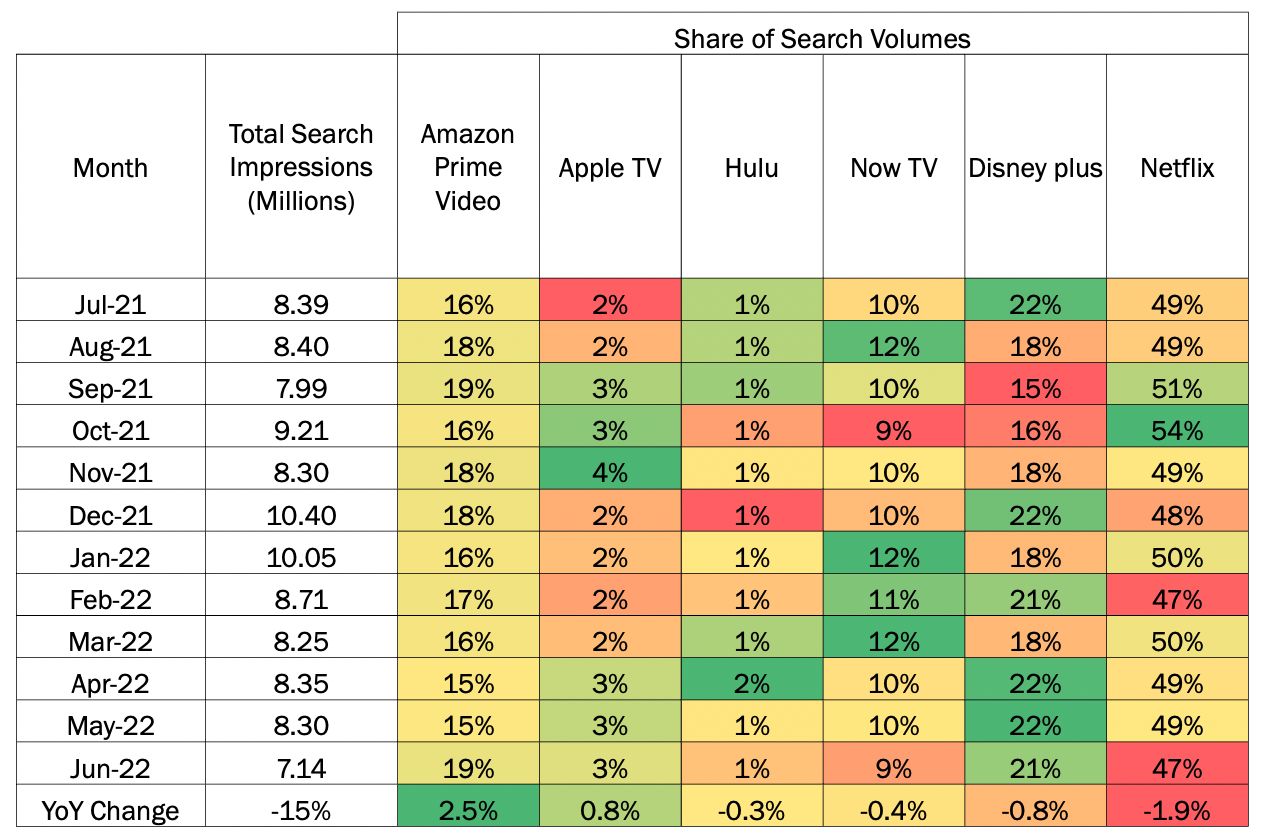
Let’s now see how share of search can be applied to the UK’s streaming market.
The first thing to note is that total search volume in the market has fallen by 15% over 12 months, reflecting the fact that 488,000 UK households have left the streaming market between April and June 2022 (Kantar).
Further, Netflix’s leading share of search figures are supported by its real-world market leading share of 35% (Statista). Amazon Prime and Disney Plus have similar share of search figures, although Amazon currently has the greater market share of 27% compared to Disney’s 19%. Interestingly though, Amazon’s growth in share of search is reflected by success in claiming the greatest share of new subscribers in Q2 2022 (25.9%) compared to competitors.
Lastly, Now TV’s share of search figure of around 10% is perfectly aligned to its UK market share which also stands at 10% (Statista).

3. Demand gen benchmarking
Is the demand we created for our latest launch better or worse than those that came before it? How did our launch benchmark vs our competition? Using search data to benchmark demand generation effectiveness
In the world of the brand funnel (that can take weeks or months of polling), there is no better source of data for mid-funnel interest and intent than search.
There are a number of things to consider when using demand generation benchmarking - failure to do so may deem the results of any research invalid.
-
A bigger existing customer base can mean more people searching for a new product or service. Accounting for this increased audience size is critical when assessing market demand.
-
Search analysis is better suited to brands, products and services with unique names. However it is still possible to run this analysis on names used by multiple brands with more evolved methods.
-
It is important to focus analysis on pre-purchase and purchase-related research - detaching complaints, in-line product queries and other outliers.
There are two great use cases for measuring your marketing department’s demand generation performance:
Example 1: Horizontal benchmarking of sequential product launches, this answers ‘did we do better at generating interest than last time?’
In this example we’ve used Google trends to compare the successive launches of the iPhone 11, 12 and 13. From a demand gen perspective, we can conclude that the iPhone 13 failed to generate as much search demand the two previous launches.


Example 2: Vertical benchmarking of your product launches vs a competitive set, this answers ‘did we do better than the competition?’
Here we’ve again used Google trends to compare the relative performances of three new PlayStation games that were all released in August of 2022. This data suggests that Thymesia and Rollerdrome achieved similar levels of demand gen, with Midnight Fight Express producing noticeably less.


Correlating share of search & search volumes with volume actuals is a powerful approach that can provide early readings on commercial performance – particularly during pre-launch. This can help brands prepare for countermeasures to pricing, increased supply requirements, and more.

4. Product positioning insight
What are the consumer needs that our product marketing and advertising need to focus on? Using search as a big-data consumer insight tool.
Search is also a vehicle for the language that consumers are using to describe something - businesses can identify trending keywords that consumers are associating within a category to their advantage.
It can also identify changes in the needs and primary purchase drivers. While interest in smartphones in an ongoing occurrence, the drivers of purchase can change over time as consumers needs change.
In the below example we see a move from ‘best smartphone’ to ‘best camera phone’. This can be traced back to a change in communication strategy such as Apple and Huawei who focussed almost exclusively on highlighting the camera capabilities. Search analysis can pre-empt changes in consumer needs and therefore give a company direction on where to position their messaging.

This analysis can support product or services features as well as overall benefits as highlighted in the below example which shows a significant switching in search between ‘best’ and ‘cheap’. This can influence the product or service proposition and the development of communication.

Consumers are constantly look for things that interest or relate to them and these are changing over time. At a mass and even niche level we can identify changes that provide insight into future opportunities.

5. Market Prediction
How can I predict changes to my market? Using search as a predictive tool
As well as Google Trends being used to analyse user's interests across various markets, big data is now being used to forecast trends rather than just monitor them.
Sectors including IT, communications, medicine, health, and economics are utilising search as a predictive tool because it so clearly offers instant reflection of the needs, wants, demands and interests of its users.
-
Tourism demand forecasting is essential for the industry as it heavily influences business decisions. In a study comparing forecasting models with web and/or image search indices regarding two cities (Vienna and Barcelona) and two countries (Austria and Belgium) it was found that the timely nature of the data was vastly more useful than the general data which appears following a 2-month lag.
Search engines have become one of the starting points for travel information searches and search terms including geographical locations such as city, region, and country names and make up nearly 60% of travel related search inquiries. Naturally, the volume of destination searches reflect an indication of interest and therefore convert to actual visitors in the future.
-
Google search trends can also be used to forecast stock market movements, highly valuable as if people can predict stock market tops and bottoms they have the opportunity to be more strategic.
Stock market research shows that when traders search for terms e.g. “how to buy Tesla shares or buy Apple stocks,” that stock will outperform – it is a clear window into trader’s intent. The more Google searches registered, the more stocks of that company were traded. However, this doesn’t tell us about stock price behaviour.
To do this we can study keywords such as “what stocks to buy,” “how to invest,” “buy stocks,” “top stocks.” These key phrases often appear when the stock market is hot and subsequently new investors are tempted to trade- a spike in these term searches indicates a spike in stock prices.
Three prominent spikes in Google search volumes show a significant reaction in the stock market.
-
Seasonal and pandemic influenza epidemics are a major public health concern, causing tens of millions of respiratory illnesses and 250,000 to 500,000 deaths worldwide each year. Early detection of disease activity, when followed by a rapid response, can reduce the impact of both seasonal and pandemic influenza. One way to improve early detection is to monitor health-seeking behaviour in the form of online search queries.
This study aggregated historical logs of online health search queries submitted between 2003 and 2008 and analysed these alongside the publication of influenza reports. The study concluded that at different points throughout the season, across the nine regions studied, they were able to estimate consistently any health breakouts 1–2 weeks ahead of the publication of reports by the US Centers for Disease Control and Prevention.
Google web search logs can provide one of the most timely, broad-reaching influenza monitoring systems available. Whereas traditional systems require 1–2 weeks to gather and process data, search results can do this daily.
6. Summary
It is no surprise that commercially-relevant insights, driven by data, are of paramount importance when digitally optimising your sales and marketing strategy. Share of Search data is often overlooked when undertaking this, and in those cases that it is used it is often utilised solely by performance marketers. The aim of this paper was to provide people outside of the performance marketing field with the tools they need to start thinking about the importance of this data set.
If you want to take this strategy further and investigate the ways that you can use Share of Search to its full potential, we can help. At Bridge F61 we use search as a core factor in our work. We develop bespoke research methods and run strategic audits for companies across sectors and sizes and always provide additional commercial insight from data sets.
We also offer
CMO to CMO
360 marketing SWOT conducted by a team of experienced CMOs.
Digital 360
Forensic deep dive on digital marketing and acquisition capability.
Growth hunter
Category driver and differentiator mapping to reveal optimal hunting grounds.
Value-first segmentation
Integrated sales and marketing segmentation to drive high growth strategy and GTM.
Investment harmonisation
Marketing investment optimisation, KPI design and performance governance.
Active research
Brand, proposition and marketing strategy, by way of primary research.
Find out more about the services we offer on our services page, and contact us at hello@bridgef61.com to arrange a call with the team.